Improving user experience : AB Testing changes
We will be using statistical tools to validate improvements in the retention rate of our app
In this post we will find out how to choose the best location for multiple capacitated facilities given a set of points of interest
Code and data used: https://github.com/davbom97/source
The capacitated multi-facility location problem is an extension of the single facility problem to n facilities simultaneously. In this project, the objective is to find the optimal location of multiple facilities at the same time, given a maximum output capacity, in Italy.
The hypotheses are quite the same as the single facility location problem but we dropped the hypothesis that a facility can supply infinite demand.
First we load the data about all the italian cities with more than 5000 population (ISTAT 2013 data)
import pandas as pd
from geopy.geocoders import Nominatim
import numpy as np
import plotly.express as px
import plotly.graph_objects as go
from sklearn.cluster import KMeans
from IPython.display import display
import time
import pickle
data = pd.read_csv("cities_data_fromMax_to5mil.csv")
display(data.head())
display(data.tail())
| city_name | pop_size | lat | long | |
|---|---|---|---|---|
| 0 | Varallo Pombia | 5004 | 45.665904 | 8.632693 |
| 1 | Certosa di Pavia | 5004 | 45.257015 | 9.148114 |
| 2 | Mistretta | 5014 | 37.929885 | 14.362873 |
| 3 | Santa Teresa Gallura | 5018 | 41.241377 | 9.188518 |
| 4 | Alzate Brianza | 5019 | 45.769778 | 9.182041 |
| city_name | pop_size | lat | long | |
|---|---|---|---|---|
| 2370 | Palermo | 657561 | 38.111227 | 13.352443 |
| 2371 | Torino | 872367 | 45.067755 | 7.682489 |
| 2372 | Napoli | 962003 | 40.835934 | 14.248783 |
| 2373 | Milano | 1242123 | 45.466800 | 9.190500 |
| 2374 | Roma | 2617175 | 41.894802 | 12.485338 |
The latitude and longitude are retrieved the same way as explained in the single facility location problem.
Next it is important to check if the data is representative, we sum all the population of the cities we are considering and divide them by the total population of Italy at that time.
np.round(data.loc[:,"pop_size"].sum()/59433744,3)
0.822
The cities represent the 82.2% of all the population of italy which is representative enough.
Suppose this time that the number of people buying our product is the 10% of the population, equally distributed across all the cities.
Then we must calculate the weight of each city by dividing the number of potential clients in each city by the total number of clients
pt_clients_perc = 0.1
clients = np.round(data.loc[:,"pop_size"].values*pt_clients_perc)
clients_perc = pd.DataFrame(clients/clients.sum(),columns = ["weight"])
data = data.join(clients_perc)
data = data.join(pd.DataFrame(clients,columns = ["number_of_clients"]))
#data = data.join(clients)
display(data.head())
| city_name | pop_size | lat | long | weight | number_of_clients | |
|---|---|---|---|---|---|---|
| 0 | Varallo Pombia | 5004 | 45.665904 | 8.632693 | 0.000102 | 500.0 |
| 1 | Certosa di Pavia | 5004 | 45.257015 | 9.148114 | 0.000102 | 500.0 |
| 2 | Mistretta | 5014 | 37.929885 | 14.362873 | 0.000103 | 501.0 |
| 3 | Santa Teresa Gallura | 5018 | 41.241377 | 9.188518 | 0.000103 | 502.0 |
| 4 | Alzate Brianza | 5019 | 45.769778 | 9.182041 | 0.000103 | 502.0 |
The way we will find the solution is by using a clustering method, in particular the K-Means algorithm, which seeks to minimize the distance between each point in a cluster (the cities assigned to a particular facility) and the centre of the cluster (the facility itself)
First we initialize the clustering process by putting all the cities in one cluster
coordinates_df = data.loc[:,["lat","long"]]
n = 1

#solver.fit(coordinates_df,sample_weight = data.loc[:,"%clients"] )
#location = solver.cluster_centers_
#labels = data.set_index(solver.labels_)
Now we introduce a constraint max_capacity, defined as the maximum amount of product units the facility can output in one year, divided by the total demand of the output in one year, for a single product
suppose the maximum output is 1500 units/day the maximum capacity is:
units_day = 1500
units_year = units_day*365
max_capacity = np.round(units_year/clients.sum(),6)
print(f"The maximum capacity for each facility is {max_capacity}")
print(f"Which equals to a maximum yearly output of {units_year} units/year ")
The maximum capacity for each facility is 0.112119
Which equals to a maximum yearly output of 547500 units/year
The total sum of the demand (or weights) for i-th facility must be less or equal than the units_year (or max_capacity).
Next we define the function find_optimum that takes in the minimum amount of facilities we want to locate and find an optimal amount of facilities with the aforementioned contraint. Then, among the possible solutions we calculate the the average saturation rate, defined as :
\[\textrm{Saturation rate}_j = \frac{\textrm{output}_j}{\textrm{maximum output}} = \frac{\sum w_{ij}}{\textrm{maximum output}}\]\(\textrm{output}_j = \textrm{The sum of the weights of the cities supplied by the j-th facility}\) \(w_{ij} = \textrm{The weight of the i-th city supplied by the j-th facility}\) \(\textrm{maximum output} = \textrm{The maximum sum of weights a facility can supply}\)
In this case, given a maximum daily output of 1500 units/day:
\[\textrm{Saturation rate}_j = \frac{\textrm{output}_j}{0.1129}\]In the end we pick the combination of facilities with the maximum saturation rate.
def find_optimum(starting_n):
    n = starting_n
    optimal_solution = None
    optimal_cluster_n = 10000  #initializes the variables that will hold the optimum
    optimal_array = [] #optimal array will contain the all the possible optimum solutions
    optimal_capacity = [] #optimal capacity will contain the output of the faclities in a given solution
    while True:
        print (f"Trying number of facilities = {n}")
        labels = data.set_index(np.zeros(len(data.index)))
        #These lines will initialize the labels array which will hold the clusters
        for j in range(200):
            solver = KMeans(n,n_init = 1,max_iter = 1000,tol = 1e-9,init = "k-means++")
            solver.fit(coordinates_df,sample_weight = data.loc[:,"weight"])
            labels = pd.DataFrame(solver.labels_,columns = ["label"])
            labels = data.set_index(solver.labels_)
            #fits the kmeans algorithm to the data points

            for i in range(0,n):
                used_capacity = labels.groupby(level=0)["weight"].sum().values
            #computes used_capacity which measures how much the capacity of each facility is saturated
            if all([i <= max_capacity for i in used_capacity]):
                #if the capacity of all the facilities is not saturated, it is considered the minimum amount of facilities
                #that satisfy the capacity contraint,and will search an optimum among them,
                #otherwise the loop continues
                optimal_cluster_n = n
                optimal_array.append(solver)
                optimal_capacity.append(used_capacity)

        if optimal_array:
            #calculates the average output of each found solution, then picks the one with the maximum avg output
            optimal_capacity_avg = [facility_used_capacity.mean() for facility_used_capacity in optimal_capacity]
            optimal_saturation = max(optimal_capacity_avg)
            indx = optimal_capacity_avg.index(optimal_saturation)
            used_capacity = optimal_capacity[indx]
            optimal_solution = optimal_array[indx]
            print("Done!")
            return optimal_cluster_n,optimal_solution,used_capacity
        if optimal_solution == None:
            n+=1
            continue
        else:
            break
We run the algorithm starting from one facility :
cluster_n,solver,used_capacity = find_optimum(9)
location = solver.cluster_centers_
labels = data.set_index(solver.labels_)
Trying number of facilities = 9
Trying number of facilities = 10
Trying number of facilities = 11
Trying number of facilities = 12
Trying number of facilities = 13
Trying number of facilities = 14
Trying number of facilities = 15
Trying number of facilities = 16
Trying number of facilities = 17
Done!
We might run the algorithm multiple times, becouse it does not guarantee that it outputs a feasible location for each facility.
Then we plot our found facilities on a map to check feasibility of the results:
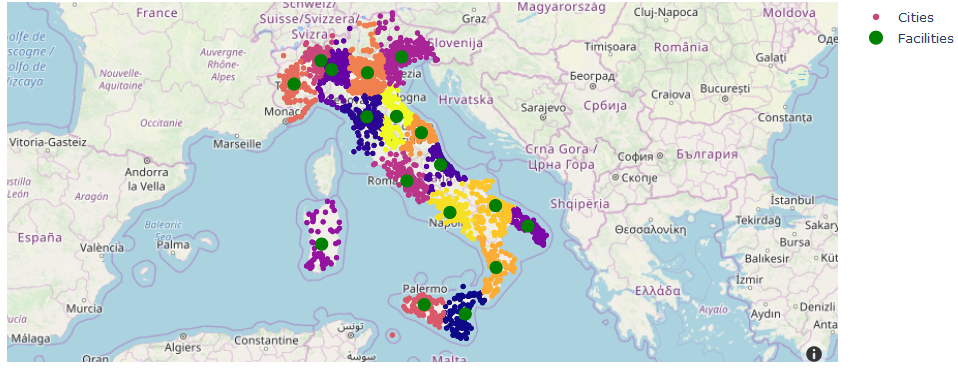
Next we locate the facilities from the coordinates
geoloc = Nominatim(user_agent="Facility_loc_problem")
addresses = []
i = 0
while True :
    try:
        if i == len(location):
            break
        else:
            loc = geoloc.reverse(location[i],exactly_one = True)
            addresses.append(loc[0])
            time.sleep(2)
            i+=1
    except:
        time.sleep(20)

facilities = pd.DataFrame(location,index = addresses,columns = ["Latitude","Longitude"])
facilities = facilities.join(pd.DataFrame(np.arange(cluster_n),index = addresses, columns = ["Cluster number"]))
The last step is to calculate the saturation rate and display the results
print(f"The optimal number of facilities is = {cluster_n}")
saturation_avg = np.around(sum(used_capacity*100)/(cluster_n*max_capacity),2)
saturation_pctg = np.around(used_capacity*100/max_capacity,2)
facility_output = np.round(saturation_pctg/100*units_day,0)
print(f"The average saturation rate is = {saturation_avg}%")
facilities = facilities.join(pd.DataFrame(saturation_pctg,
                                          index = facilities.index,
                                          columns = ["Saturation rate(%)"]))
facilities = facilities.join(pd.DataFrame(facility_output,
                                          index = facilities.index,
                                          columns = ["Daily facility output(pieces/day)"]))
facilities = facilities.join(pd.DataFrame(facility_output*365,
                                          index = facilities.index,
                                          columns = ["Yearly facility output(pieces/year)"]))
The optimal number of facilities is = 17
The average saturation rate is = 52.47%
labels.index = labels.index.set_names("Cluster number")
display(facilities)
display(labels.head())
| Latitude | Longitude | Cluster number | Saturation rate(%) | Daily facility output(pieces/day) | Yearly facility output(pieces/year) | |
|---|---|---|---|---|---|---|
| Poggio del Lupo, Misterbianco, Catania, Sicilia, 95045, Italia | 37.545541 | 15.038274 | 0 | 48.32 | 725.0 | 264625.0 |
| Via Simoncini, Ville, Serravalle Pistoiese, Pistoia, Toscana, 51130, Italia | 43.889483 | 10.859511 | 1 | 70.31 | 1055.0 | 385075.0 |
| Cartiera, Loreto Aprutino, Pescara, Abruzzo, 65014, Italia | 42.405641 | 13.996831 | 2 | 22.45 | 337.0 | 123005.0 |
| Santa Maria in Prato, San Zenone al Lambro, Milano, Lombardia, 26852, Italia | 45.316446 | 9.363823 | 3 | 95.78 | 1437.0 | 524505.0 |
| Erchie, Brindisi, Puglia, 72028, Italia | 40.451648 | 17.710318 | 4 | 32.12 | 482.0 | 175930.0 |
| Circonvallazione sud, Asuni, Aristanis/Oristano, Sardegna, Italia | 39.861941 | 8.945599 | 5 | 19.93 | 299.0 | 109135.0 |
| Via Brigata Emilia, Pero, Breda di Piave, Treviso, Veneto, 31048, Italia | 45.700320 | 12.342201 | 6 | 70.84 | 1063.0 | 387995.0 |
| Via Prenestina, Quartiere XIX Prenestino-Centocelle, Roma, Roma Capitale, Lazio, 00171, Italia | 41.894788 | 12.560785 | 7 | 91.55 | 1373.0 | 501145.0 |
| Parcheggio Stadio, Via Palermo, San Bernardino, Oltrestazione, Legnano, Milano, Lombardia, 20025, Italia | 45.588261 | 8.910030 | 8 | 55.69 | 835.0 | 304775.0 |
| Mulino Drago, Strada statale Corleonese Agrigentina, Casa Sant'Ippolito, Corleone, Palermo, Sicilia, 90030, Italia | 37.860989 | 13.297069 | 9 | 36.99 | 555.0 | 202575.0 |
| Via Tetti Laghi, Cascina Reggenza, Carmagnola, Torino, Piemonte, 10022, Italia | 44.885312 | 7.767223 | 10 | 50.88 | 763.0 | 278495.0 |
| Via Paradiso, Maldritto, Castelbelforte, Mantova, Lombardia, 46032, Italia | 45.223828 | 10.887862 | 11 | 77.83 | 1167.0 | 425955.0 |
| Valcarecce, Cingoli, Macerata, Marche, 60039, Italia | 43.402066 | 13.177101 | 12 | 22.85 | 343.0 | 125195.0 |
| strada Liardi Iunci, Iunci Soprano, Catanzaro, Calabria, 88049, Italia | 39.096233 | 16.353780 | 13 | 20.05 | 301.0 | 109865.0 |
| Masseria Friuli, Corato, Bari, Puglia, Italia | 41.106532 | 16.329850 | 14 | 44.45 | 667.0 | 243455.0 |
| Cutinelli, Sant'Anastasia, Napoli, Campania, 80038, Italia | 40.889406 | 14.389779 | 15 | 95.82 | 1437.0 | 524505.0 |
| Turrito, Sarsina, Unione dei comuni Valle del Savio, Forlì-Cesena, Emilia-Romagna, Italia | 43.907781 | 12.121604 | 16 | 36.05 | 541.0 | 197465.0 |
| city_name | pop_size | lat | long | weight | number_of_clients | |
|---|---|---|---|---|---|---|
| Cluster number | ||||||
| 8 | Varallo Pombia | 5004 | 45.665904 | 8.632693 | 0.000102 | 500.0 |
| 3 | Certosa di Pavia | 5004 | 45.257015 | 9.148114 | 0.000102 | 500.0 |
| 0 | Mistretta | 5014 | 37.929885 | 14.362873 | 0.000103 | 501.0 |
| 5 | Santa Teresa Gallura | 5018 | 41.241377 | 9.188518 | 0.000103 | 502.0 |
| 8 | Alzate Brianza | 5019 | 45.769778 | 9.182041 | 0.000103 | 502.0 |
Then we save the facilities and the clusters for use or for further analysis using pickle
save = [labels,facilities]
pickle.dump(save,open("Multi_facility_clients_and_facilities.pkl","wb"))
We will be using statistical tools to validate improvements in the retention rate of our app
We will analyze the sales data of the videogames market using the data about games with more than 100000 copies sold
In this post we will find out how to choose the best location for multiple capacitated facilities given a set of points of interest
In this post we will find out how to choose the best location for a single uncapacitated facility given a set of points of interest